A simple time-series model of pandemic excess deaths: part 3
Age-specific and lagged analyses, and accounting for autocorrelated errors

Introduction
The first post of this series developed a simple time series model to explain variation in pandemic US excess deaths from 2020-2022 using COVID waves and vaccine administration rates. In the second post of the series, we examined an oddity in the results that ended up revealing ‘bumps’ in excess deaths in the several weeks following peaks in the primary series, first booster, and bivalent vaccine “waves”. An incisive reader also commented that examining age-specific mortality is important since the temporal pattern of excess deaths (and vaccination peaks to some extent) will vary across age-groups and time.
The original model tests for ‘static’ effects of vaccination: that is associations between same-week vaccinations with same-week excess deaths. This post will extend the model to age-specific excess deaths and also examine lags of up to 10 weeks (i.e. test whether current week vaccinations are associated with excess deaths 1 to 10 weeks later).
Unfortunately, it is difficult, if not impossible, to obtain all 3 variables in the same age strata and across all of 2020-2022. However, there are arguments for keeping the vaccination regressor the same for all age groups. For example, vaccinations in one age group may impact other ages groups as well through i.e. shedding or vaccine-induced vehicular fatal accidents (an adverse event that impairs operator of the vehicle). Other than ages under 16, which had a very different rollout schedule, the shape of the vaccinations regressor will be largely similar across age groups, though their peaks will likely be shifted in time in younger vs older age groups. Likewise, COVID waves shapes should largely be similar across age groups, and any differences in their amplitudes can be accounted for by the 8 separate COVID cases terms in our model. Thus for the following age-specific results, only the excess-deaths outcome variable is different in each model, while a 0-10 weeks lag is applied to the vaccine doses term.
After this, we will examine the residuals of the model to confirm it needs an adjustment for the fact that the model does not meet classic linear model assumptions: namely the residuals are both heteroscedastic (their variance is not consistent across model fitted values) and also autocorrelated (error terms one time point are significantly correlated with the error term at the previous time point). This means that with ordinary least squares (OLS) the t-values and p-values are likely inflated as these issues tend to bias down the coefficient standard errors. I’ll therefore conclude the post by re-estimating the age-specific and lagged vaccine terms’ t and p-values using heteroscedasticity and autocorrelation consistent (HAC) covariance estimators.
Age and lag effects
The below tables lists the t and p-values for just the vaccine coefficients from the model described in Part 1 using OLS. Each column shows results whereby the vaccine regressors is lagged relative to the excess deaths from 0 weeks up to 10 weeks (i.e. testing effects of vaccinations on excess deaths 1-10 weeks into the future).
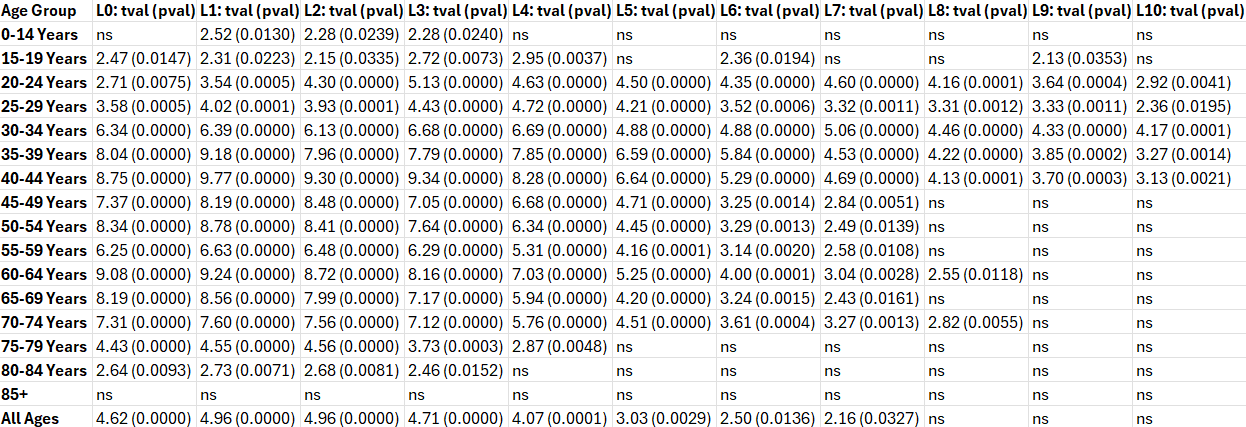
As expected based on the plots in Part 2 of this series, the results show positive vaccine terms from lag 0 through 6 weeks in most age groups, with effects appearing to persist through 10 weeks in ages 20-45 years. Interestingly, no significant effects were detected in ages 85 and over, possibly because deaths from COVID and natural causes overwhelm any signal in this age group.
Residuals analysis
All the above results use OLS which assume errors are independently distributed and homoscedastic (constant variance of the residuals), among other classic modeling assumptions. Time series data are likely to violate at least one assumption, namely that error terms are independent from each. First, we’ll plot residuals vs. fitted values to see if the residuals are homoscedastic.

The residuals appear to be heteroscedastic (residuals’ variance increases as fitted values increase). Next, we plotted the errors as a function of time (case order), and also the errors each time point vs. error terms in the previous time point.

The plots confirm that we need to adjust for heteroscedastic and autocorrelated error terms.
Improving statistical inference of the model
To acknowledge the presence of heteroscedastic and autocorrelated error terms, we will estimate heteroscedastic-and-autocorrelation-consistent (HAC) coefficients and standard errors. With HAC, OLS coefficient estimates are unchanged, but tests of their significance become more reliable. An advantage of HAC estimators is that they do not require detailed knowledge of the nature of the heteroscedasticity or autocorrelation in the errors in order to compute consistent estimates of the standard errors. For this, we will compute Newey-West coefficient covariance matrices in Matlab (Octave) as outlined in this link and [1]. For anyone following along using a different software, R has a library called sandwich which implements different HAC estimators, including Newey-West.

To aid in interpreting the results, an “age by lag” t-value heatmap was created in which HAC-adjusted t-values for vaccine terms surviving p<0.05 FDR corrected are displayed in the figure below.
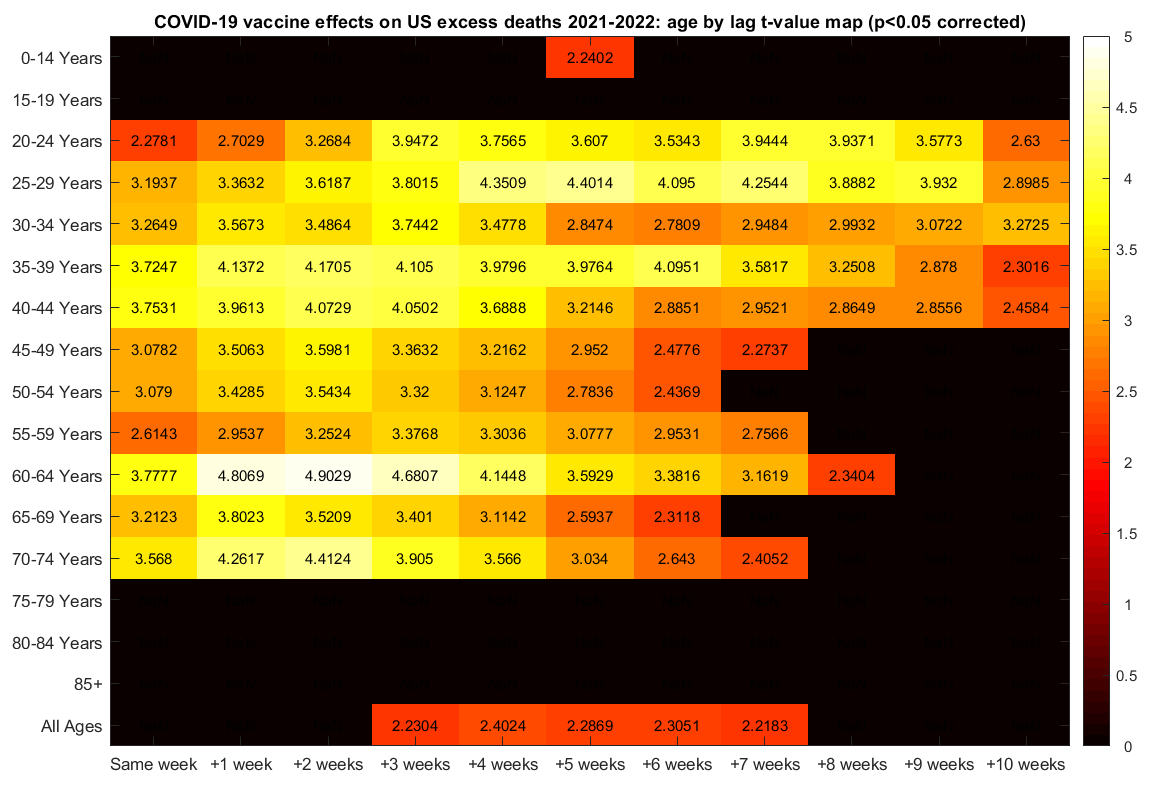
After the adjustment for heteroscedastic and autocorrelated errors, the vaccine term survives correction for multiple comparisons in ages 20-75, but not in ages over 75. In all ages, the vaccine term is marginally significant at lags 0-2 weeks (t-values=1.6, 1.9, and 2.1, uncorrected p-values=0.11, 0.06 and 0.04, respectively, data not shown), and it survives correction for multiple comparisons at lags 3-7 weeks. The vaccine coefficient estimates at lags 0-7 weeks in all age groups were 0.0003299, 0.0003723, 0.0003644, 0.0003364, 0.0002893, 0.0002095, and 0.0001642, respectively. The vaccine coefficient estimates the expected number of excess deaths (“rise”) per increase in one dose (“run”). Multiplying the coefficient at lag 0 by 100 yields a percent estimate of the per dose vaccine fatality rate within a week post-injection (i.e. 0.033%). Multiplying this coefficient (0.00033) by the total doses administered in 2021-2022 (663,822,575) yields an estimated 219,000 excess deaths occurred within a week of vaccination. Note that only one lagged vaccine term was included in each model at a time in order to preclude issues stemming from multicollinearity.
Conclusion
In this 3-part series, time series regression was applied to examine contributors to US pandemic excess deaths in 2020-2022. Excess deaths (dependent variable) were defined as the differences in weekly deaths relative to same-week deaths averaged over years 2015-2019. The model included two exposures (independent variables): COVID cases and weekly COVID vaccines doses administered. The latter was used to test whether changes in weekly doses were associated with changes in weekly excess deaths, after adjusting for the effects of COVID cases. The results revealed positive (adverse) effects of vaccine doses on excess deaths. Lagged analyses suggest these effects persist for 6-10 weeks post-injection. The estimated coefficients suggest over 200,000 excess deaths in 2021-2022 were caused by vaccinations in the same week. For all code and datasets used in this series of posts see the STIMPED Github. The Github includes copies of the raw datasets, the Matlab (Octave) code used to extract and consolidate the data, and csv files with consolidated data that can be imported into your software of choice.
Acknowledgments
Mike Deskevich, Simon Thornley and Steve Kirsch provided critical feedback on the methods and results.
References
[1] Andrews, D. W. K., and J. C. Monohan. "An Improved Heteroskedasticity and Autocorrelation Consistent Covariance Matrix Estimator." Econometrica. Vol. 60, 1992, pp. 953–966.
Wait, there’s more!
If you enjoyed this post, please consider dropping me a tip! Your donation will help support my efforts to publish this work.
I was unlawfully terminated from my faculty and research scientist positions because of my research on COVID vaccine risks and benefits and other protected activity. If you would like to learn more or help me in my legal pursuit of justice, please see this link.
You can get Brazilian record level for all-cause mortality here (including date of birth, date of death, sex, basic cause, underlying causes, etc.) : https://opendatasus.saude.gov.br/dataset/sim
And record level covid vax data here (including date of birth, sex, dose, type, etc.): https://opendatasus.saude.gov.br/dataset/covid-19-vacinacao
And SARS database info here, with even more fields: https://opendatasus.saude.gov.br/dataset/srag-2021-a-2024
One of the first things you will observe if you have the patience to look at this stuff (I´ve long ago lost mine) is that in Brazil, the number of covid attributed deaths (ICD B342) is going to be EQUAL to excess mortality, or in other words, the following model was adopted:
EXCESS MORTALITY = COVID MORTALITY = EXCESS MORTALITY
This can be easily verified using a highly sophisticated model called the EXCEL PROJECTION FUNCTION - with a monthly index for "seasonal adjustment" - I learned this method watching a five minute YouTube video of an Indian guy with a really bad accent.
Of course, the model is only valid until January of 2022, when the covid vax campaign was declared a roaring success, whereupon excess mortality was twice covid mortality .... but who cares.
When I tried running your code in Octave, it said `the 'readtable' function is not yet implemented in Octave`.
I tried reproducing your heatmap in R so that I also included negative lags, but my results were completely different from your code, so I don't know if you can figure out what I did wrong: https://pastebin.com/raw/vCY0MM9k, https://i.ibb.co/QS89fkk/stimped-reproduction-fail.png.