

Did COVID vaccination reduce COVID deaths in ages 65 and older?
Responding to valid critiques of my previous post on Robinson's paradox

Summary and highlights
As part of the 1M debate, the opposition correctly pointed out a weakness in my previous post in which population size was not adequately controlled for in a plot that purported to show a positive correlation between COVID vaccination and subsequent month COVID deaths.
After aggregating COVID deaths and doses across the entire year, the models in all ages and ages 65 plus adequately adjusted for population size.
Results show COVID vaccinations have a positive (adverse) effect on subsequent year COVID deaths, consistent with the known risk of COVID vaccines enhancing respiratory disease via antibody dependent enhancement after antibody levels wane.
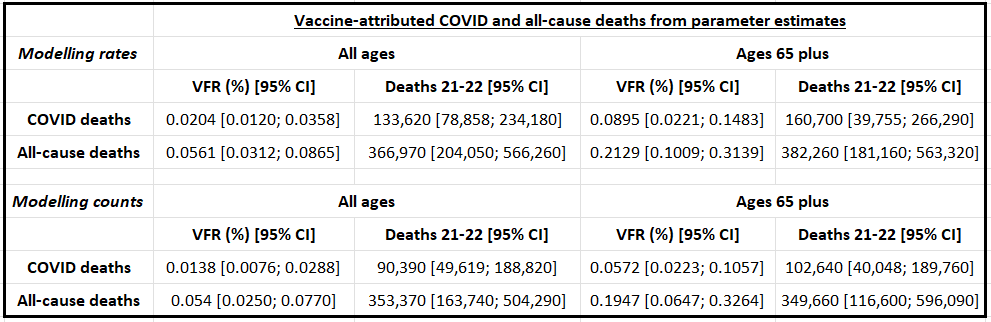
Parameter estimates suggest that over 100,000 COVID deaths (20% of all COVID deaths in 2021-2022), and over 350,000 all-cause deaths in 2021-2022, may be attributed to COVID vaccinations. The majority occurred in ages over 65.
All data is publicly available from the CDC and was compiled into CSV tables available in the project Github so that results can be independently verified and confirmed in Excel or other software in under 10 minutes.
Background
In the last round of the big debate on whether the COVID vaccines saved more lives than they killed, the opposition criticized a plot in my post on Robinson’s paradox.

The opposition (correctly) pointed out that the plot did not adequately adjust for population size, which I confirmed by correlating the residuals (y-axis) with population (r=0.62, p<0.001). In contrast to monthly ecological regressions using total and non-COVID deaths [1], modelling COVID deaths the same way does not adequately adjust for population size.
The opposition also points out:
Interestingly, if we try to do a quick manual adjustment for size, and examine which states are farthest from the trendline (which we now know simply represents size), we see that:
Countries that are farthest below the trendline (less deaths than expected) are those with high vaccination rates: California, New York, New Jersey, Massachusetts, Connecticut.
Countries that are farthest above the trendline (more deaths than expected) are those with low vaccination rates: Texas, Tennessee, Michigan, Arkansas, South Carolina, Oklahoma.
The two exceptions are:
Florida, which was lax on NPIs.
Oregon, which had very low covid deaths, but may have appeared high in this chart due to even lower deaths in 2020, making 2021 appear relatively high.
Consistent with their criticisms, the residuals appear negatively correlated with percent vaccinations, but does not reach statistical significance (r=-0.14, p=0.38).
Improving the model
The model was therefore improved by using yearly deaths and vaccine doses to predict (change in) subsequent year deaths. All analyses in the post used two data sources from the CDC: one with US vaccinations and the other with COVID and total deaths. Given that the CDC provides both vaccine dose counts and COVID and all-cause deaths in ages 65 plus, the analysis was repeated using vaccine doses and yearly deaths in all ages and in ages over 65 only.
The following log-log regression models were estimated:
where each Y and X is a 52x1 size vector of deaths or vaccine doses for each of 52 US states/territories. Fitting the model yields a positive beta2 term, indicating a positive association between 2021 vaccinations and subsequent year deaths as shown below.
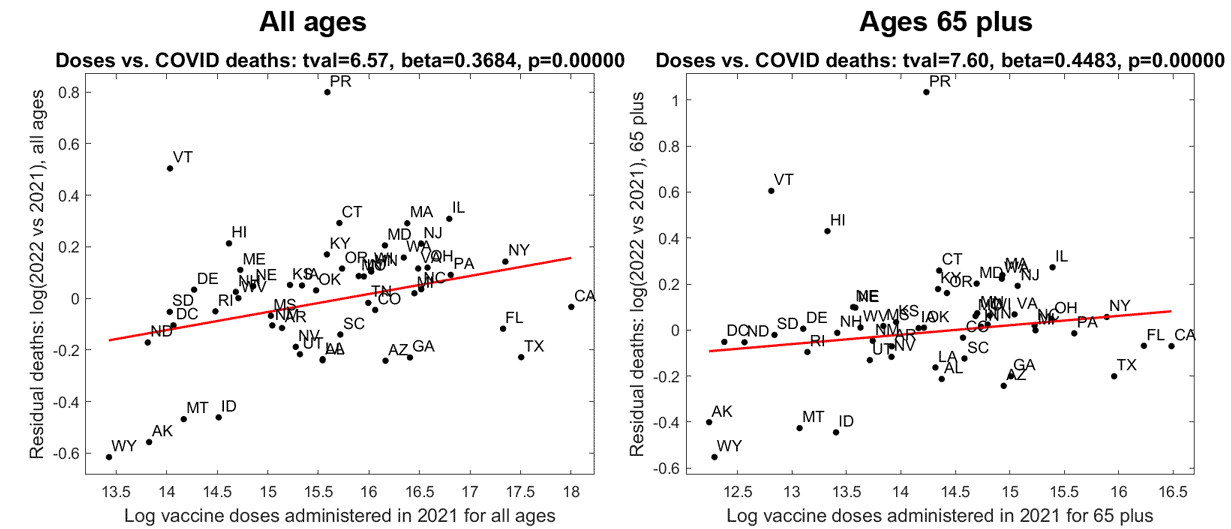
Population is now uncorrelated with the residuals (y-axis) (all ages r=0.24, p=0.09; 65 plus r=18, p=0.21). The 2021 percent vaccinations also correlate positively with the residuals (all ages r=0.61, p=2.6e-06; 65 plus r=0.37, p=0.0075), indicating that highly vaccinated states show more COVID deaths in 2022 than expected. To further confirm that population was adequately adjusted for, percent vaccinated (vaccine doses divided by population) was substituted for the X(vax) term in the regression model. As with raw counts, this also yielded positive beta estimates for the vaccination term (all ages beta=0.63, p=4.5e-06; 65 plus beta=0.64, p=1.9e-04).
Modelling rates instead of counts
To further confirm population was adjusted for, percent vaccinated was correlated with percent change in COVID deaths ([2022 COVID deaths - 2021 COVID deaths] / 2021 COVID deaths). This confirmed positive relationships (all ages r=0.68, p=1.1e-07; 65 plus r=0.46, p=6.1e-04) as plotted below:

The plots show that with the exception of Vermont and Puerto Rico (and Hawaii for ages 65 plus), COVID deaths were reduced in 2022 relative to 2021, but less vaccinated states had greater reductions in COVID deaths.
Estimating the number of vaccine-associated COVID deaths
The slopes of the best fit lines in the above plots (beta weights) were used to estimate vaccine-associated COVID deaths in ages 65 plus. Ninety-five percent confidence intervals were estimated using bootstrap resampling with replacement (2,000 iterations). To stabilize the parameter estimates and tighten the 95% confidence intervals, outliers are first removed by omitting states whose residuals fell below or above the 10th and 90th percentile, respectively. Plots after removing outliers are shown below:

A simple linear regression was fitted as follows:
where Y is a 52x1 vector with percent change in deaths from 2021 to 2022, and X is a 52x1 vector of percent vaccinated (or doses divided by population) in 2021. The beta1 states that for every 1% increase in 2021 vaccinations, there will be a beta1 * 1% increase in deaths in 2022. A per dose VFR is estimated by taking the “rise” (increase in deaths) over the “run” (i.e. an increase of 1% in vaccinations).
The fitted beta weights (beta1) were 0.3639 (all ages) and 0.5204 (65 plus). A one percent increase in 2021 US COVID deaths in ages 65 plus is 0.01 * 226,272 = 2,263 COVID deaths. A one percent increase in US vaccine doses administered in ages 65 plus is 0.01 *131,560,268 = 1,315,603 doses. Beta1 * 1% increase in deaths is (0.5204 * 2,263 COVID deaths), and dividing this by 1,315,603 doses yields 0.000895 (95% CI: 0.000221, 0.001483), or 0.0895% VFR for COVID deaths in ages 65 plus. Multiplying this VFR by the total number of doses administered to ages 65 plus in the US during 2021 and 2022 (179,543,464) yields 160,690 vaccine-associated COVID deaths (95% CI: 39,755; 266,290).
According to Statista, there were 707,719 COVID deaths in the US during 2021 and 2022. The results suggest that about 160,690/707,719, or ~20% of COVID deaths in 2021-2022, were caused by COVID vaccines, with the majority occurring in ages 65 plus. This is consistent with the known risk of COVID vaccines in worsening respiratory disease via antibody dependent enhancement after antibody levels wane (see Cardozo et al. 2021 and [2]).
What about all-cause deaths?
Substituting total deaths for COVID deaths in the log-log models results in positive associations between 2021 vaccine doses and 2022 all-cause deaths (all ages beta=0.0769, tval=4.71, p=2.0e-05, 65 plus beta=0.1075, tval=4.60, p=3.0e-05, data not shown). Furthermore, the residuals are uncorrelated with population (all ages r=0.08, p=0.56, 65 plus r=0.04, p=0.77) and are correlated with percent vaccinated (all ages r=0.65, p=4.8e-07, 65 plus r=0.49, p=3.0e-04), indicating more highly vaccinated states have higher 2022 all-cause deaths than expected.
Similarly, correlating percent vaccinated in 2021 with percent change in total deaths confirms the findings:

The table below summarizes the results when using regression on rates or counts.
Do the results replicate?
The above analyses were repeated, but this time using 2022 deaths and doses to predict 2023 deaths, and the results largely replicate (for plots see Figures folder in the Github). Although this is not a strictly independent replication (2022-2023 data is correlated with 2021-2022 data), the results further validate a relationship between vaccinations and mortality using ecological regression.
Conclusion
Using yearly, and not monthly, COVID deaths adequately adjusts for population size when modelling raw counts of deaths and doses. Results suggest 20% of COVID deaths in 2021-2022 were caused by COVID vaccines, providing real-world evidence of antibody dependent enhancement of respiratory disease. Parameter estimates also indicate over 350,000 total deaths in this same period may have been caused by COVID vaccination.
In contrast to time-series regression, which captures short-term effects, ecological regression can capture longer term effects of vaccination. Our recently develop time-series model also shows an adverse effect of vaccination on mortality, with an estimated 200,000 deaths occurring within a few weeks post-injection. Combining their results suggest over 500,000 US deaths in 2021-2022 may be attributed to COVID vaccination. All code, raw and derived data can be accessed at https://github.com/spiropan/COVFR-YEAR.
References
[1] Pantazatos, S. & Seligmann, H. COVID Vaccination and Age-Stratified All-Cause Mortality Risk. https://doi.org/10.13140/RG.2.2.28257.43366 (2021) doi:10.13140/RG.2.2.28257.43366.
[2] Cardozo, T. & Veazey, R. Informed consent disclosure to vaccine trial subjects of risk of COVID-19 vaccines worsening clinical disease. Int J Clin Pract 75, e13795 (2021).
Wait, there’s more!
If you enjoyed this post, please consider dropping me a tip! Your donation will help support my efforts to publish this work.
I was unlawfully terminated from my faculty and research scientist positions because of my research on COVID vaccine risks and other protected activity. If you would like to learn more or help me in my legal pursuit of justice, please see this link.
In several datasets the ratio between unvaccinated and vaccinated COVID mortality is greater in 2021 than 2022. So it might explain why states with a low percentage of vaccinated people would also have elevated mortality in 2021 relative to 2022. By 2022 many unvaccinated people had acquired natural immunity, so relative to a baseline of unvaccinated people, vaccines seem to have provided a greater immunization advantage in 2021 than 2022: sars2.net/rootclaim3.html#Comparison_of_COVID_deaths_in_2022_relative_to_2021_by_Spiro_Pantazatos.